

How to Get Quality Backlinks Using Infographic Outreach
Want to know how to get high quality backlinks with an infographic creation and promotion strategy? Get the keys to Infographic Outreach right now!
![]()
Infographics are, or I should say, can be a powerful tool for building backlinks. The key is the outreach.
Infographics are one of the most popular and highly shared forms of visual content on the web, and many marketers see these combinations of design, words, images, and data as the key to high-quality backlinks.
But what good are those powerful graphics if they’re not being shared by key influencers?
In this article, we’ll walk you through how to create and promote a high-quality infographic. Everything from exploring why infographics matter to walking through the initial planning steps, we’ll give you a better idea of what makes a great infographic more likely to be picked up and shared by others.
Why do infographics work?
Everything on the web conveys information to the reader.
Sometimes, this exchange is deliberate: the reader clicks on a news article and reads about that particular story. At other times, information transfer is much more subtle.
Images, for instance, convey information to those seeing them without the need for any deliberate action.
Here are some pretty persuasive statistics on infographic outreach and their popularity for marketing:
- Infographics can increase web traffic by 12%. (Demand Gen Report)
- Posts that include images receive 650% higher engagement than text-only posts. (Webdam)
- 30% of marketers use original graphics, such as infographics, more than any other type of visual content, including videos and GIFs. (Venngage)
- When asked which types of visuals had the highest engagement, 42% of marketers reported that infographics and other original graphics were the most engaging. This was higher than any other form of visual content. (Venngage)
- Content with relevant images gets 94% more views than content without relevant images. (Quick Sprout)
- Infographics are liked and shared on social media 3x more than other any other type of content. (NN Group)
By combining both images and text into one appealing and shareable format, infographics provide both the flash (images) and substance (text) needed to engage readers. Put that in an engaging, lively design, and you have the winning recipe for content that readers can both learn things from and digest easily.
Quality counts
Simply creating a random infographic doesn’t necessarily mean you’re on the fast track to high-quality backlinks.
The sites you outreach to are likely bombarded on a daily basis with infographics. To rise above the rabble, you’ll need yours to stand out.
When is your infographic too much (or not enough)?
The best infographics hit that sweet spot of providing useful information and data without being boring or too promotional.
This is a fine line: infographics need to contain enough substance to be worth reading but packing too much info into it will typically cause the reader to lose interest.
The quality of your infographic directly impacts how successful your promotion strategy will be. A low-quality infographic that fails to grab the reader’s attention isn’t likely to grab the attention of the person you’re sharing it with, either. If you are building backlinks, put the extra time, research, and money into better infographics. It will make your life a lot easier and your infographic outreach much more successful.
Remember: the ultimate goal is to give value and links will follow.
Putting your infographic together
At this point, you have a good understanding of what goes into making a highly effective and shareable infographic. Let’s next explore some of the questions you should ask yourself as you plan out the project:
What is the topic?
You’ll need to start by finding the right topic for a highly effective infographic.
The ideal topic:
- Answers a commonly asked question
- Provides a unique perspective or outlook
- Connects with current trends or events
Once you have found a subject that fits these criteria, do an image search to see what other infographics are out there. If you find a lot of high-quality infographics on your chosen topic, you may need to either change your topic or create a new spin to make yours stand out from the crowd.
This process is a lot like crafting evergreen content.
Who is the audience?
Consider who you want reading and sharing your infographic.
Tailor the content, image, and larger narrative of the infographic to this audience. For example; if you’re putting together an infographic for first-time homebuyers; You’ll want to include definitions for terms such as “ROI” and “escrow.” If you’re making an infographic about what kinds of home improvements help sell homes faster, be sure to include quality images of renovated homes.
What story is the infographic trying to tell?
If you want your infographic outreach to be a success, your infographic needs to be more than just a random collection of interesting statistics.
Consider the following questions when you’re plotting out your next infographic:
- What is the overall message of the infographic?
- How does the infographic progress from start-to-finish?
- What is the intended action you want readers to take?
Not every infographic has a clear call-to-action. Many exist simply to convey information. But, thinking ahead about the content of the piece can help you craft a more effective message—and make it more likely that your infographic is picked up and shared by high-quality sites.
How does the infographic design inform that story?
Now that you have your audience and your story, you’ll want to think about how the design complements both.
Is your infographic straightforward?
Or is it stylized, with stand-out fonts and illustrations?
There’s no one “right” way to design an infographic—your decisions should be based on the subject matter and therefore can vary widely from project to project. One point to make here is that you may want to have a professional design put into your infographic to give it a better chance of getting the most shares by the webmasters. In general, cartoon-like infographics are cool but a professionally designed infographic with high quality images will get a better chance at getting shared by the webmasters. If your design skills are not where you want them to be, consider hiring a professional graphic designer.
Online Infographic Builders
If you do have the time and design skills to create your own infographics, there are no shortage of infographic builders online. I’m not going to list them all, just my two favorite:
1. PiktoChart

PiktoChart markets itself as the tool that let’s “non designers create beautiful infographics in as little as 10 minutes.
I was acually a little surprised at how good this tool was when I first used it. Piktochart has over 400 fully customizable themes with retina-ready images, objects, graphs, and colors you can edit and adjust according to your preference.
It makes creating infographics a pretty easy experience.
5. Canva
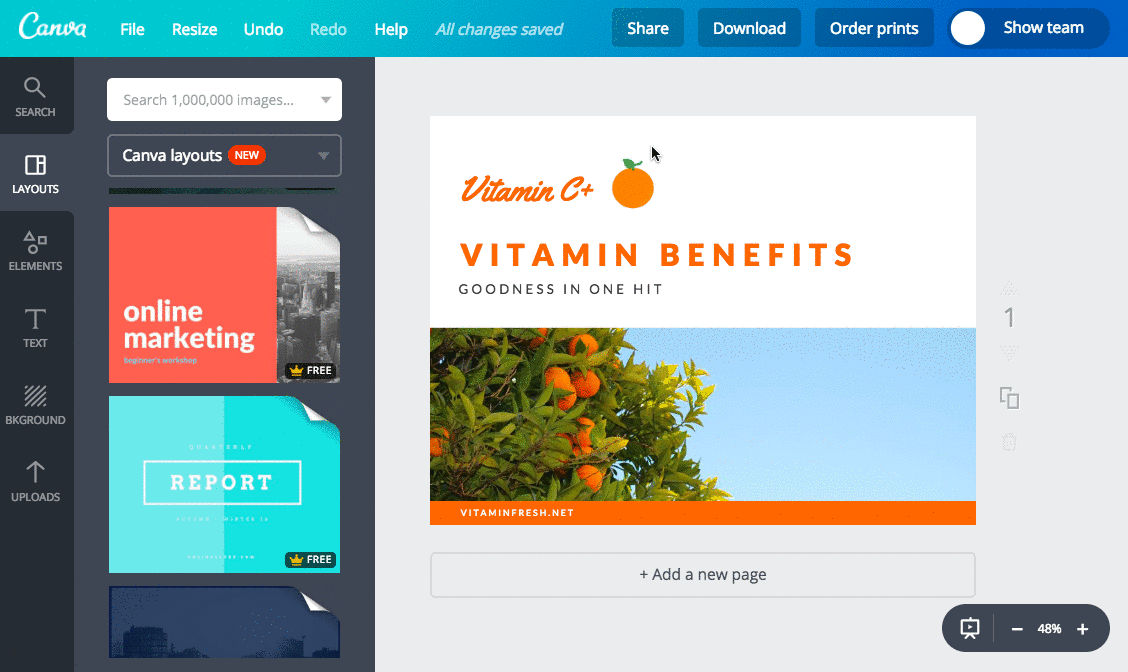
Canva is the very first infographic creator that I ever used and it is still in my top two.
I like the brief overview tutorial that Canva provides, but more than that, I like the user interface — it’s very intuitive and easy to use. After a brief overview you’ll be creating your project whether it be a presentation, Facebook cover photo, business card, ad, poster, banner, or a retina-ready infographic.
Promoting your content
Once the infographic is complete, it’s time to start promoting your content so that you can generate backlinks for your website. Here’s how to begin the infographic outreach simply by sharing your content for maximum exposure:
Start by publishing
Start by posting the infographic to your website or blog. Be sure to have social media sharing buttons enabled so that people who like your content can share it with others. Also, include an embed code. This will allow people who share their infographic on their own sites to attribute it back to your site.
Get social
Arguably the easiest place to start promoting your own content is through your own social media channels.
Take it a step further by reaching out to specific groups or communities that fit with the infographic audience you determined earlier. If you have the budget to do so, you may also want to boost your posts to more widely distribute your infographic beyond just those you’re connected with on Facebook, LinkedIn, Pinterest, or Twitter.
You should also attempt to connect with social media influencers in the same field as the infographic. Find influencers who regularly share infographics and message them with a link to yours. Having your new infographic shared by the right influencers can start a domino effect, where the other webmasters and influencers you reached out to decide to share it as well.
Reach out to relevant websites
If you haven’t already, find a list of the top-ranking websites with blogs in your vertical.
Find places where your infographic is a good fit and share what you’ve created with that site’s webmaster. You may not receive a response from every blog you reach out to, but a high-quality infographic should get some attention. Pay attention to your email pitch and how you frame the infographic: focus on the story and narrative of the image and how it fits with what that website does.
When sending your initial emails, don’t attach the image yet. Just inform the webmaster that you created a professionally designed infographic and simply ask if they would like to see it. If they ask to see the infographic and even better, if they like it then offer the webmaster an article to go with it.
It should be common sense that infographics should not take the place of written content.
Reach out to relevant social media influencers
Creating social media signals not only will help with SEO rankings (indirectly) but will also create some buzz about your infographic. After the infographic has been posted on your blog, use AHREFS or Google search to find relevant social media accounts (Facebook should work the best here).
Usually, social media influencers of small to medium size would be more willing to share the client’s infographic link. Most of the times, the super popular social media accounts only share the links from their blogs.
What comes next?
Take the lessons learned from your infographic creation process and apply them to your next project. The outreach process itself may spawn new ideas for infographic topics based on what influencers and webmasters are seeking. Or, looking at other infographics can give you new design concepts for your own vertical.
Either way, aim to improve at least one aspect of your infographics each time you start a new project.

