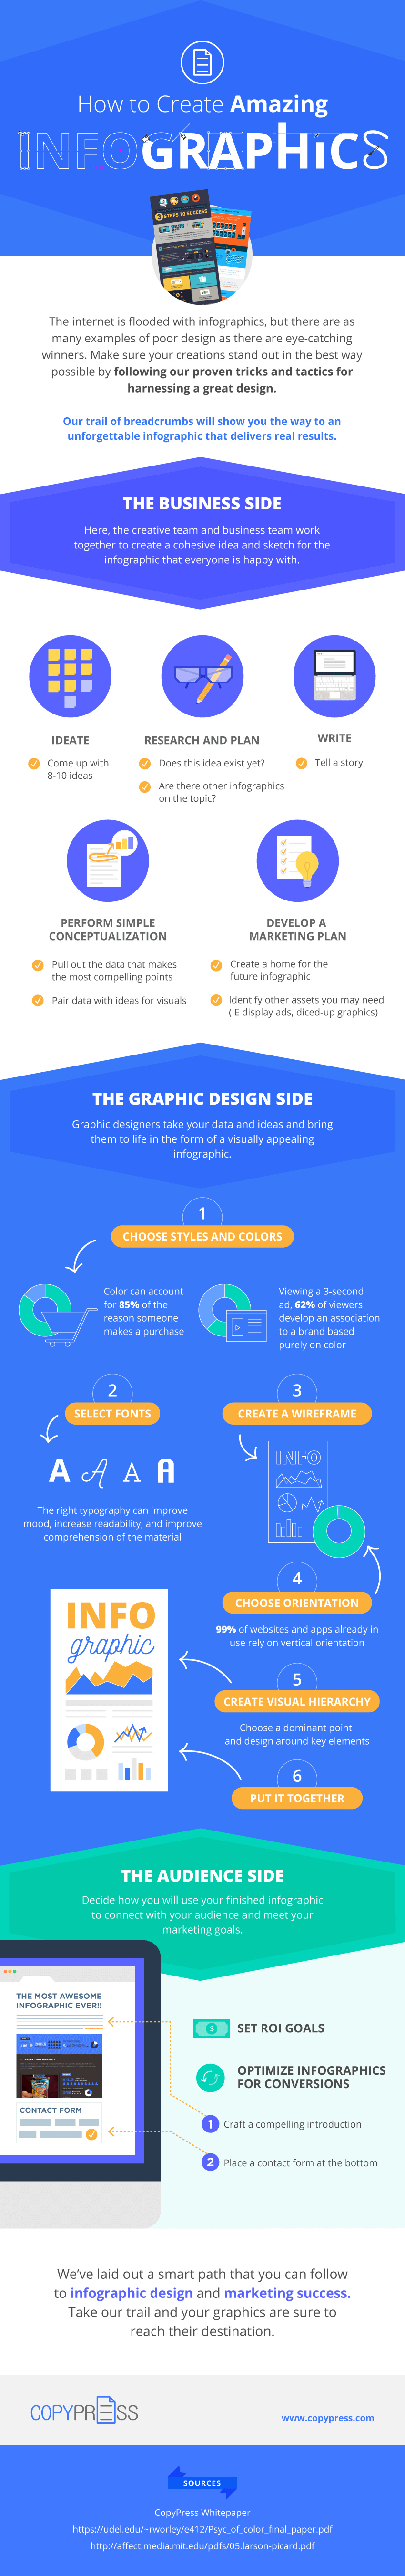
How To Create Amazing Infographics
Want to start creating your own amazing infographics? This infographic will show you how to research, plan and execute your own infographics for marketing success.
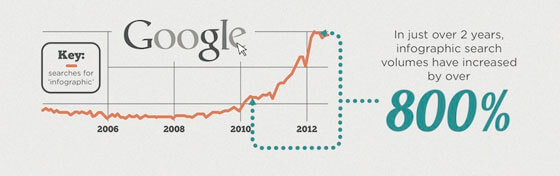
If you are a business owner or marketer who has been trying to grow their company’s online presence, these infographic stats might be important to you.
Infographics pair informative copy with eye-catching graphics and transform complex ideas into easy to understand narratives. They are designed to share an idea or information to a specific audience as well as gain traffic, boost SEO, and help build a following. Due to their visually pleasing and engaging nature, most people respond better to infographics over traditional articles and blog posts.
In fact, publishers who use infographics grow in traffic an average of 12% more than those that don’t.
With infographics, you have a lot of flexibility. They can be embedded and shared all over the web, with the potential to go viral. They are also capable of including clickables and even video to enhance their audience engagement. For longevity, infographics can be broken up into smaller sections and re-shared later to target audiences. More importantly, they can give your brand a personality and voice in ways that standard black and white text cannot.
If you are creating your own infographics, you have to remember that the most crucial part of the content is the topic. Without a compelling idea, pretty visuals alone cannot keep your readers engaged. You want to provide your audience with information that they will find useful and informative. The main goal should be keeping them engaged so that they absorb the information, rather than just skimming through the images.
If you’re interested in creating your own infographic, check out the information below to get started.
Get the Free White Paper, straight from the source!