Tips for Digital Marketers using Data Visualization to Engage Audiences
If you’re a digital marketer, you have to show – not tell. By using data visualization to engage audiences you can up your marketing game.

If you actually want your audience to read your marketing material, then making sure your content is engaging is a must. Using Data visualization is one of those ways that you can show your audience, rather than tell them through data and information in general.
What is data visualization? Today’s world is one that’s driven by data and information. With the rise of computing and technology as we know it today, data is valuable and it’s highly effective when shared with the relevant, target audience.
The data we collect is also fairly easy to record and analyze, thanks to the incredible technology and tools we have access to. This technology is not only available for big companies but affordable for small to medium enterprises too.
As humans, we process mainly visual information. According to MIT, 90% of information is transmitted to the brain visually, so it makes sense to incorporate as much data visualization into your marketing and advertising efforts.
Keeping your audiences engaged in the content you’re sharing is essential. Otherwise, they’ll lose interest and the effort put into said content, will be wasted.
What is data visualization?
What is data visualization? Today’s world is one that’s driven by data and information. With the rise of computing and technology as we know it today, data is valuable and it’s highly effective when shared with the relevant, target audience.
The data we collect is also fairly easy to record and analyze, thanks to the incredible technology and tools we have access to. This technology is not only available for big companies but affordable for small to medium enterprises too.
As humans, we process mainly visual information. According to MIT, 90% of information is transmitted to the brain visually, so it makes sense to incorporate as much data visualization into your marketing and advertising efforts.
Keeping your audiences engaged in the content you’re sharing is essential. Otherwise, they’ll lose interest and the effort put into said content, will be wasted.
Tips for using Data Visualization to Engage Audiences
When it comes to digital marketing, there are a lot of ways in which digital marketers can attract their audience. Data visualization provides plenty of that if done properly. With that said, here are a few tips that any digital marketer can utilize in order to engage their audiences fully.
1. Make a graph with Piktochart
Looking at a graph can be fairly boring for most people. However, if done right, you can create visual graphs that will make it impossible to avert your eyes.
Piktochart is a great resource for creating visual graphs that are not only insightful but they’re also enjoyable to look at. Data visualization like graphs doesn’t need to be lacklustre when it comes to color and shape. They can have depth and cater to the relevant branding colours of the business in question.
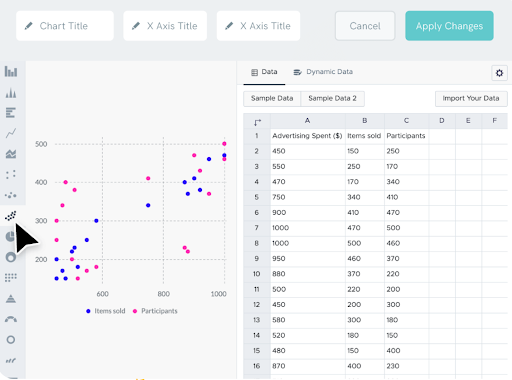
Creating data visuals becomes more of an enjoyable experience, rather than it having to be monochrome and flat. You can make a graph with Piktochart with their free online graph maker which is easy to use, no matter who uses it!
Piktochart is easy enough to create graphs with ease and generate visuals that tell the story or share the data desired.
2. Ensure the data is strong and compelling
Data needs to be strong and compelling, otherwise even the most beautifully-made data visuals will not get the engagement they deserve. The data needs to be unique and provide some use for the audience it’s meant for.
Find new ways to present the data so that you’re not simply copying off something that’s already been done. It needs to live up to the satisfaction of your audience, otherwise, it’s not going to be effective. The data will still look bad, no matter how much you dress it up with beautiful color schemes and fancy visuals.
If you think your data is lacking, then go back a few steps before you progress any further, or make any additional effort to your data visuals. It’s good to spend time collecting quality data that’s going to provide educational benefits to your audience.
3. Focus on simplicity when designing
Simplicity is often all that’s needed when it comes to data visualization. It’s good to keep things simple without overcomplicating them. After all, data visualization is the vehicle that’s conveying the information.
Don’t get lost in the design, despite such great tools being made available to us. It’s very easy to get lost in the design and neglect the information you’re trying to get across. Try to take a minimalist approach when designing your data visuals and try to strip it back if you feel like you’re giving too much.
You may find that adding on one or two additions is more than enough for your visuals, especially as there are so many tools that can do all sorts of creative effects. All you’ll need is interesting data and the simplicity of your design will do the rest.
4. What is the end goal?
When creating data visuals, it’s important to remember what the end goal is. What are you trying to achieve from sharing the data in this way? Just like any good story or presentation, stick to the point at hand. Try to avoid getting distracted at any point within the process of designing or implementing the data.
Be picky about what data you include in your data visuals too. The last thing you want is to add too much fluff and for the text to overcomplicate the visual you’re trying to achieve.
Don’t get caught up in the need to impress on every point either. Try to keep your messaging simple and if there’s too much data to fit onto one graph or chart, break it down into other visuals. It’s good to have some variety after all!
5. Use visual hierarchy to highlight
Drawing the eye in the appropriate manner is essential to having the audience engage with all of the points you’re making on the page.
A well-designed page or set of data visuals is going to ensure the user sees it all. The objective of your page, whatever that content might be, needs to be front and centre.
In order to help guide the audience to the right areas of the page, visual hierarchy is key. This can help highlight the relevant data and information required.
This can be done through the use of color and position of the data visual on the page. Use white space on the page to provide relief for the reader’s eyes to digest the content at their own pace.
Why engaging with your audience is key in 2022
As a business, engaging with your audience is essential. It’s what keeps your business relevant, particularly in 2022. There are many reasons why you should be engaging with your audience for your business this year.
1. It helps build a relationship
Phi Dang, CEO of Sidepost, says, “One of the major benefits of engaging with your audience is that it can help build relationships with those who require it.” He further added, “As a customer, it’s important to feel valued and appreciated by the business they spend money on.”
When it comes to your customers, taking the time and effort to provide them with what they need is crucial. Whether it’s rewarding them with more than they expected to interact with them on a regular basis, it’s all essential to helping build a relationship.
2. Improves sales and channel traffic
As a business, the two important elements to find success is by improving sales and channel traffic. Sales are important to help build on the financial part of the business and channel traffic helps boost interest in the business further down the line.
Data visuals can be a great way to help gain that extra traffic and to help convert any leads that you’ve perhaps been nurturing through various marketing methods thus far.
3. It builds a reputation in the industry
Within your own industry, your reputation is everything. A reputation stained is not one that can be easy to come back from, so it’s important that you’re always aware of everything you do and how that could affect the business.
Engaging with your business can help with building a reputation that your company may need. Your audience is influential when it comes to the state of your reputation, so it’s certainly something to be aware of.
Use data visualization to engage your audience this year
Using data visualization to engage your audience is a powerful tool that any business could benefit from. It’s something that can help establish a presence on the market or it can be useful for helping generate more interest in the product or services you offer.
However you use data visuals, make sure you do them properly and that they’ve been created to give you the best opportunities as a business. Focus on the quality of the design and having strong data that’s compelling for your audience.